5π Consulting
Use Prometheus Vector Matching to get Kubernetes Utilization across any Pod Label
November 09, 2017
Prometheus was designed for dynamic environments like Kubernetes. Its powerful service discovery and query language allows you to answer all kind of questions that come up while operating a Kubernetes cluster.
This flexibility comes with a somewhat steeper learning curve than some alternatives and hosted services, with Vector Matching being one of the more advanced topics.
I’m not going into the details which the excellent Prometheus Documentation has already covered but walk you through some useful queries to get resource utilization in a Kubernetes cluster.
Aggregated memory usage per label
Kubernetes provides a container_memory_usage_bytes metric reflecting each pods
memory usage, e.g:
...
container_memory_usage_bytes{beta_kubernetes_io_arch="amd64",beta_kubernetes_io_fluentd_ds_ready="true",beta_kubernetes_io_instance_type="g1-small",beta_kubernetes_io_os="linux",cloud_google_com_gke_nodepool="small-preemptible",cloud_google_com_gke_preemptible="true",container_name="POD",failure_domain_beta_kubernetes_io_region="us-east1",failure_domain_beta_kubernetes_io_zone="us-east1-c",id="/kubepods/burstable/pod13d4221c-c484-11e7-bff5-42010af0018b/67e5bb069ab9881ff8a55b8628ef4935b0d1ace09c18df20db059522bdfd5b7d",image="gcr.io/google_containers/pause-amd64:3.0",instance="gke-latency-at-small-preemptible-0c981b61-9489",job="kubernetes-cadvisor",kubernetes_io_hostname="gke-latency-at-small-preemptible-0c981b61-9489",name="k8s_POD_latency-api-971504058-jzs5h_default_13d4221c-c484-11e7-bff5-42010af0018b_0",namespace="default",pod_name="latency-api-971504058-jzs5h"}	389120
container_memory_usage_bytes{beta_kubernetes_io_arch="amd64",beta_kubernetes_io_fluentd_ds_ready="true",beta_kubernetes_io_instance_type="g1-small",beta_kubernetes_io_os="linux",cloud_google_com_gke_nodepool="small-preemptible",cloud_google_com_gke_preemptible="true",container_name="POD",failure_domain_beta_kubernetes_io_region="us-east1",failure_domain_beta_kubernetes_io_zone="us-east1-c",id="/kubepods/burstable/pod81d0f651-c500-11e7-bff5-42010af0018b/309e05b118e618122c70ccf88538d13ca41c3b5a770d5d67882426854391c23c",image="gcr.io/google_containers/pause-amd64:3.0",instance="gke-latency-at-small-preemptible-0c981b61-9489",job="kubernetes-cadvisor",kubernetes_io_hostname="gke-latency-at-small-preemptible-0c981b61-9489",name="k8s_POD_latency-api-971504058-gszpw_default_81d0f651-c500-11e7-bff5-42010af0018b_0",namespace="default",pod_name="latency-api-971504058-gszpw"}	372736
container_memory_usage_bytes{beta_kubernetes_io_arch="amd64",beta_kubernetes_io_fluentd_ds_ready="true",beta_kubernetes_io_instance_type="g1-small",beta_kubernetes_io_os="linux",cloud_google_com_gke_nodepool="small-preemptible",cloud_google_com_gke_preemptible="true",container_name="latency-api",failure_domain_beta_kubernetes_io_region="us-east1",failure_domain_beta_kubernetes_io_zone="us-east1-c",id="/kubepods/burstable/pod13d4221c-c484-11e7-bff5-42010af0018b/497e6fdf2217771cb3f52e6fef93734d023f0e7f23f92c58d22139fc18dc5f13",image="registry.gitlab.com/latency.at/latencyat@sha256:8ea057e064b64cc9c8459a68ef3f6d0fc26169b4f57aef193831779e1fe713d4",instance="gke-latency-at-small-preemptible-0c981b61-9489",job="kubernetes-cadvisor",kubernetes_io_hostname="gke-latency-at-small-preemptible-0c981b61-9489",name="k8s_latency-api_latency-api-971504058-jzs5h_default_13d4221c-c484-11e7-bff5-42010af0018b_1",namespace="default",pod_name="latency-api-971504058-jzs5h"}	11014144
container_memory_usage_bytes{beta_kubernetes_io_arch="amd64",beta_kubernetes_io_fluentd_ds_ready="true",beta_kubernetes_io_instance_type="g1-small",beta_kubernetes_io_os="linux",cloud_google_com_gke_nodepool="small-preemptible",cloud_google_com_gke_preemptible="true",container_name="latency-api",failure_domain_beta_kubernetes_io_region="us-east1",failure_domain_beta_kubernetes_io_zone="us-east1-c",id="/kubepods/burstable/pod81d0f651-c500-11e7-bff5-42010af0018b/7b438a8e9df0cf1ab29d067fd36c97099f9f5e7e9257f6187c5be6bff846a62c",image="registry.gitlab.com/latency.at/latencyat@sha256:8ea057e064b64cc9c8459a68ef3f6d0fc26169b4f57aef193831779e1fe713d4",instance="gke-latency-at-small-preemptible-0c981b61-9489",job="kubernetes-cadvisor",kubernetes_io_hostname="gke-latency-at-small-preemptible-0c981b61-9489",name="k8s_latency-api_latency-api-971504058-gszpw_default_81d0f651-c500-11e7-bff5-42010af0018b_0",namespace="default",pod_name="latency-api-971504058-gszpw"}	11448320
...
Unfortunately it doesn’t contain the pod labels. For that there is the
kube_pod_labels though which includes a static timeseries with all labels and
the pod name. This metric is provided by
kube-state-metrics.
We can use it to look up the labels for the pod from the
timeseries (pod_name="latency-api-971504058-jzs5h"):
kube_pod_labels{instance="10.116.0.12:8080",job="kubernetes-service-endpoints",k8s_app="kube-state-metrics",kubernetes_name="kube-state-metrics",kubernetes_namespace="kube-system",label_app="latency-api",label_pod_template_hash="971504058",namespace="default",pod="latency-api-971504058-jzs5h"} 1
kube_pod_labels{instance="10.116.1.26:8080",job="kubernetes-service-endpoints",k8s_app="kube-state-metrics",kubernetes_name="kube-state-metrics",kubernetes_namespace="kube-system",label_app="latency-api",label_pod_template_hash="971504058",namespace="default",pod="latency-api-971504058-jzs5h"} 1
Both metrics can be merged by using vector matching. We get this metric twice
because there are two instances of kube-state-metrics running. So before we
continue further, we aggregate both. Since they should be identical, we can use
min/max to aggregate. Since we later want to aggregate on label_app, we need
to keep that label. We also need to keep the pod label to join both metrics
on. We can preserve them by specifying them in the BY clause. Since the pod
label is called pod in kube_pod_labels but pod_name in
container_memory_usage_bytes, we need to also use label_replace to rename the
label. This gives us:
max by (pod_name,label_app) (
  label_replace(kube_pod_labels{label_app!=""},"pod_name","$1","pod","(.*)")
)
Which returns something like:
...
{label_app="latency-api",pod_name="latency-api-971504058-n8k6d"}  1
{label_app="latency-api",pod_name="latency-api-971504058-jzs5h"}  1
...
Now we can use vector matching to join container_memory_usage_bytes with the
result of our expression. We use the * operator which effectivly is a no-op
since it will multiply the memory usage by the matched timeseries value in
kube_pod_labels which is always 1.
We need to specify group_left because there are multiple
container_memory_usage_bytes timeseries for each pod, one for each container.
Since we want to preserve the label_app label, we specify it as argument to group_left.
This gives us:
  container_memory_usage_bytes * on (pod_name) group_left(label_app)
  max by (pod_name,label_app) (
    label_replace(kube_pod_labels{label_app!=""},"pod_name","$1","pod","(.*)")
  )
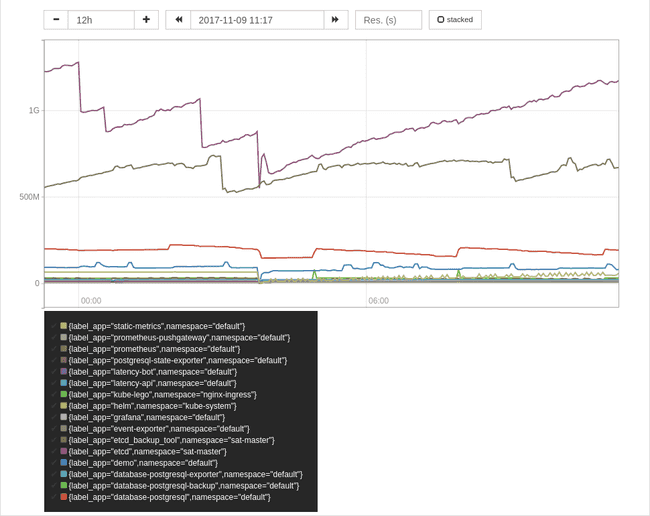
To aggregated the memory usage of all your pods, summed by a k8s-app label you
can use the following expression:
sum by (label_app,namespace) (
  container_memory_usage_bytes * on (pod_name) group_left(label_app)
  max by (pod_name,label_app) (
    label_replace(kube_pod_labels{label_app!=""},"pod_name","$1","pod","(.*)")
  )
)
CPU and IO usage per label
Now that we know how to join the kube_pod_labels metric with cadvisor metrics,
we can figure out usage of other resources too.
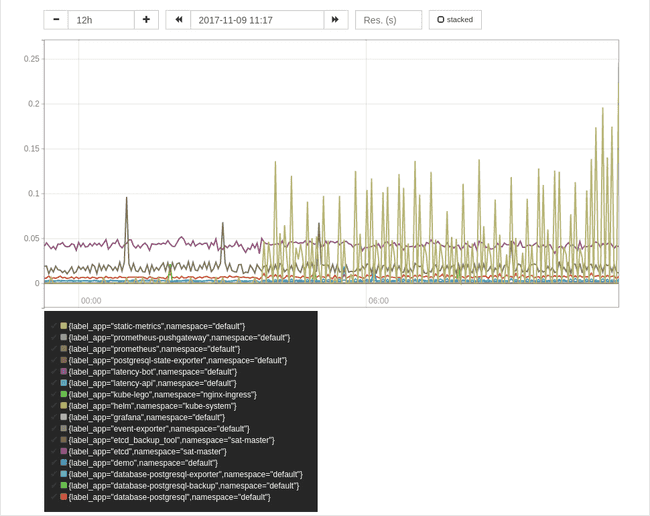
CPU
sum by (label_app,namespace) (
  rate(container_cpu_usage_seconds_total[2m]) * on (pod_name) group_left(label_app)
  max by (pod_name,label_app) (
    label_replace(kube_pod_labels{label_app!=""},"pod_name","$1","pod","(.*)")
  )
)
Disk IO
I wanted to show you some disk IO stats too. Unfortunately these are broken once again in Kubernetes.
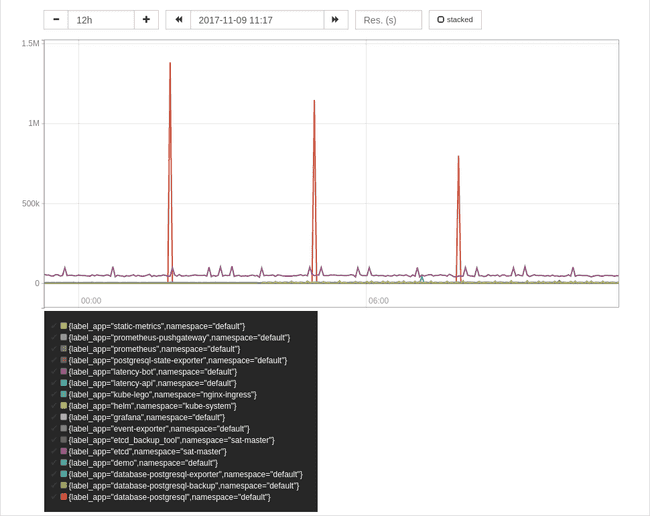
Network
sum by (label_app,namespace) (
  rate(container_network_transmit_bytes_total[2m]) * on (pod_name) group_left(label_app)
  max by (pod_name,label_app) (
    label_replace(kube_pod_labels{label_app!=""},"pod_name","$1","pod","(.*)")
  )
)


